

- POWDER DIFFRACTION ENDSTATION SAMPLE PREPARATION
- HIGH PRESSURE ENDSTATION SAMPLE PREPARATION
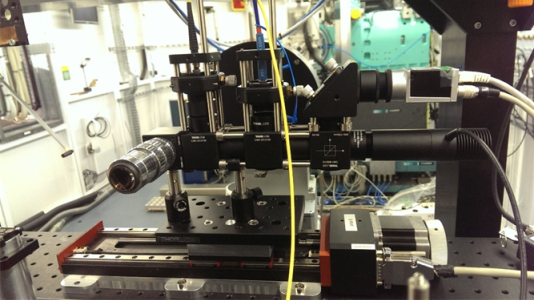
- HIGH PRESSURE ENDSTATION SUPPORT EQUIPMENT
- DIFFRACTION SOFTWARE
- INSTRUMENT PARAMETER FILES
-
Absorption should be considered since it might be an issue for samples which contain heavy elements. Calculate the linear absorption coefficient, μ (in cm-1), of the sample at the wavelength at which data will be acquired. Note, to minimise absorption correction μ*r should be <1, where r = radius of capillary (in cm) and μ must take into account the packing density (generally 40-60%). The following web pages provide tools to calculate it: APS absorption tool and NIST scattering tables.
Standard set-up consists of powder samples loaded into glass capillaries. This video gives an idea for the first time users. Quartz and borosilicate capillaries of diameter 0.3, 0.5, 0.7, 1.0 and 1.5 mm are available at the beamline. For other dimensions, massive usage or if preferred to fill capillaries at home, capillaries can be ordered from e.g; www.hilgenberg-gmbh.de, www.wjm-glas.de, www.capillarytubes.co.uk
The composition of the samples should be made known to the local contact since fluorescence reduces the signal-to-noise ratio of the MYTHEN detector considerably. This problem can be avoided (in most cases) with the correct beamline configuration.
-
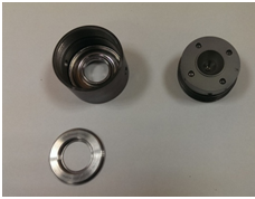
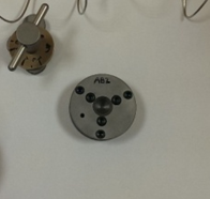
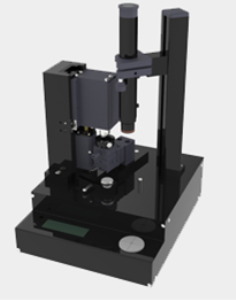
We have two types of Diamond Anvil Cells (DACs): piston-cylinder LeToullec-type with a gas-driven membrane for pressure generation (available commercially @Betsa) and plate DAC (Almax Boehler-type):
- 2 membrane DACs for Room Temperature (diamond culet size 0.3 mm and 0.4 mm)
- 2 membrane DACs for Low Temperature (CuBe alloy – diamond culet size 0.4 mm)
- 2 membrane DACs for High Temperature (diamond culet size 0.3 mm and 0.4 mm)
- 3 plate DACs for Room Temperature (diamond culet size 0.3 mm, 0.5 mm & 0.7 mm)
For all the DACs the working pressure depends on the diamond culet size installed.
The diamond anvil cells (DACs) should be requested by the users 4 weeks prior to experiments. Please contact beamline staff to verify DACs availability.
Users should be aware they are responsible of the delicate equipment used during the experiments and must strictly follow BL staff instruction.
Misuse of DAC is particularly addressed since it can lead to costly diamond breakage!!!
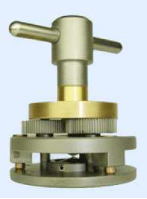
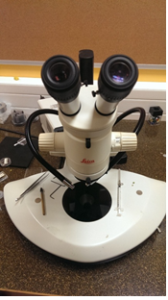
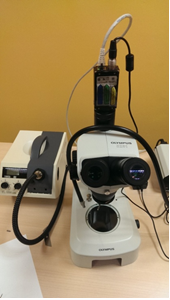
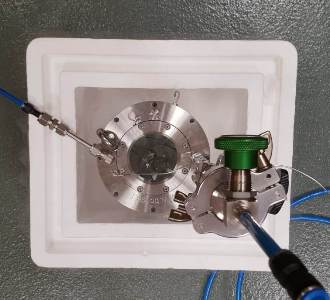
- At MSPD we have available a High Pressure laboratory for sample preparation and DAC loading including two stereo zoom microscopes, electric discharge machine, a laser drilling system (in preparation), offline ruby system, pneumatic drive systems (manual and automatic) and tools for routine DAC operation. Cryogenic gas loading of DACs is also available for argon and nitrogen loading.
-
The beamline staff contributes to the development of algorithms to solve structures from diffraction data. These algorithms are implemented in diffraction software (DAJUST, RIBOLS, TALP ... etc.). Detailed information and access to the download page.
Additional utilities and software developed also by the beamline staff are available for download:
- D2Dplot: 2D diffraction data visualization, processing, tts analysis and phase ID [windows linux]. J. Appl. Cryst. (2019). 52, 478–484. Last update: 22 Nov 2019.
- D1Dplot: 1D diffraction data visualization and processing [windows linux]. Proceedings (2020). 62(1), 9. Last update: 22 Jan 2022.
Please check the software conditions of use.
-
The instrumental resolution on the Powder diffraction station depends on the detection setup, capillary size and incoming beam divergence. Angle dependence of the peak FWHMs for various configurations at 20 keV is illustrated below. The instrumental resolution has been determined by refining a Na2Ca3Al2F14 sample. This compound is known for not introducing sample induced broadening and owing to its low density can be measured at soft energies in transmission mode. The crystal structure is described in Courbion and Ferey, Journal of Solid State Chemistry (1988) 76, 426 10.1016/0022-4596(88)90239-3

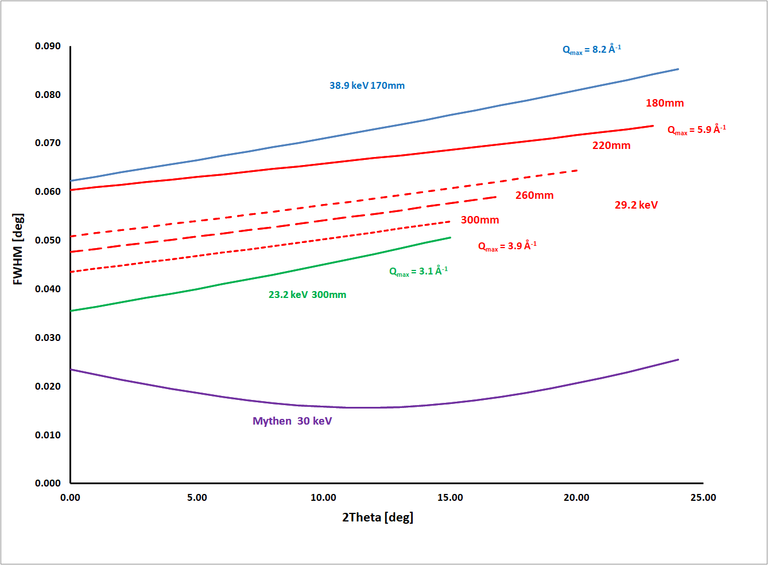
The instrumental resolution on High Pressure Endstation is angular resolution dependent. Powder diffraction patterns on a standard LaB6 (NIST standard 660b) were collected for this purpose. Angle dependence of the peak FWHMs for various configurations at different energies is illustrated below. Angular dependence of the peak FWHM at Powder Diffraction Endstation using Mythen detector is represented for comparison purposes. One can notice that the angular resolution at the HP station is inferior to the PD station counterpart due to angular limitations.
GSAS and FullProf instrument parameter files for some typical photon energies and capillary diameters can be downloaded using the links below. Additional information on this topic can be found at Kaduk, J. A., & Reid, J. (2011). Typical values of Rietveld instrument profile coefficients. Powder Diffraction, 26(1), 88–93 and references therein.
Detector
Energy
Capillary diameter
GSAS parameter file
FullProf parameter file
MYTHEN
13 keV
0.3 mm Mythen_13keV_03mm.prm BL04_MYTHEN_13keV_03mm.irf 0.5 mm Mythen_13keV_05mm.prm BL04_MYTHEN_13keV_05mm.irf 0.7 mm Mythen_13keV_07mm.prm BL04_MYTHEN_13keV_07mm.irf 1.0 mm Mythen_13keV_10mm.prm BL04_MYTHEN_13keV_10mm.irf 20 keV
0.3 mm Mythen_20keV_03mm.prm BL04_MYTHEN_20keV_03mm.irf 0.5 mm Mythen_20keV_05mm.prm BL04_MYTHEN_20keV_05mm.irf 0.7 mm Mythen_20keV_07mm.prm BL04_MYTHEN_20keV_07mm.irf 1.0 mm Mythen_20keV_10mm.prm BL04_MYTHEN_20keV_10mm.irf 30 keV
0.3 mm Mythen_30keV_03mm.prm BL04_MYTHEN_30keV_03mm.irf 0.5 mm Mythen_30keV_05mm.prm BL04_MYTHEN_30keV_05mm.irf 0.7 mm Mythen_30keV_07mm.prm BL04_MYTHEN_30keV_07mm.irf 1.0 mm Mythen_30keV_10mm.prm BL04_MYTHEN_30keV_10mm.irf MAD
13 keV
1.0 mm MAD_13keV_10mm.prm BL04_MAD_13keV_10mm.irf 20 keV
MAD_20keV_10mm.prm BL04_MAD_20keV_10mm.irf 38 keV
MAD_38keV_10mm.prm BL04_MAD_38keV_10mm.irf Recommended FullProf and GSAS instrument parameters for some typical photon energies and sample-to-detector distances are given below. Note that due to low angular range of the HP station these values are less reliable than those of the PD station.
Energy
Sample-to-detector distance
GSAS parameters
Fullprof parameters
GV GW LY V W X 29.2 keV
180 mm -8.82 6.20 18.0 -0.00489 0.00344 0.180 220 mm -7.71 5.69 11.5 -0.00428 0.00316 0.115 260 mm -5.82 4.79 10.9 -0.00323 0.00266 0.109 300 mm -2.92 3.93 10.8 -0.00162 0.00218 0.108 23.2 keV
300 mm -2.69 3.68 11.4 -0.00149 0.00204 0.114 38.9 keV
170 mm -8.92 6.40 22.4 -0.00495 0.00355 0.224
-
BEAMLINES >
BL04 - MSPD
MATERIALS SCIENCE AND POWDER DIFFRACTION BEAMLINE


